1QFY2020 Result Update | Footwear
August 3, 2019
Bata India
BUY
CMP
`1,310
Performance Update
Target Price
`1,525
Y/E March (` cr)
1QFY20
1QFY19
% yoy
4QFY19
% qoq
Investment Period
12 months
Net sales
882
797
10.6
679
29.8
EBITDA
243
132
84.3
94
157.1
Stock Info
Sector
Footwear
EBITDA margin (%)
27.5
16.5
1,101bp
13.9
1,363bp
Market Cap (Rs cr)
16,839
Adjusted PAT
101
83
22.0
88
14.1
Net Debt
(844)
Source: Company, Angel Research
Beta
0.9
52 Week High / Low
1,478/833
For 1QFY2020, Bata India (BIL) posted strong set of numbers, exceeding our
Avg. Daily Volume
48,806
expectations on bottom-line front. Revenue grew by ~11% yoy. The company’s
Face Value (Rs)
5
BSE Sensex
37,118
operating margins improved by robust 141bps yoy (after adjusting rent cost). On
N ifty
10,997
the bottom-line front, BIL reported growth of ~22% yoy to `101cr on the back of
Reuters Code
BATA.BO
strong operating performance.
Bloomberg Code
BATA.IN
Healthy volume growth drives top-line: BIL’s top-line grew by ~11% yoy to `882cr
Shareholding Pattern (%)
on the back of healthy growth in footwear segment. The growth was mainly due to
Promoters
52.9
successful brand refreshment of various product categories. The growth is
MF / Banks / Indian Fls
15.6
attributed to successful execution of "Sweeping Angela Off Her Feet" strategy.
FII / NRIs / OCBs
12.3
Indian Public / Others
19.2
Retail channel continued to grow at a steady pace and supported by double digit
growth in E- Commerce & Non-retail channel as well.
Abs. (%)
3m
1yr
3yr
Strong operating performance aids profitability: On the operating front, the
Sensex
4.8
(0.1)
32.7
BIL
(10.1)
40.4
126.5
company reported better margins, up 141bps yoy (after adjusting rent cost). On
the bottom-line front, BIL reported growth of ~22% yoy to `101cr on the back of
strong operating performance and healthy top-line growth.
Outlook and Valuation: We expect BIL to report net revenue CAGR of ~15% to
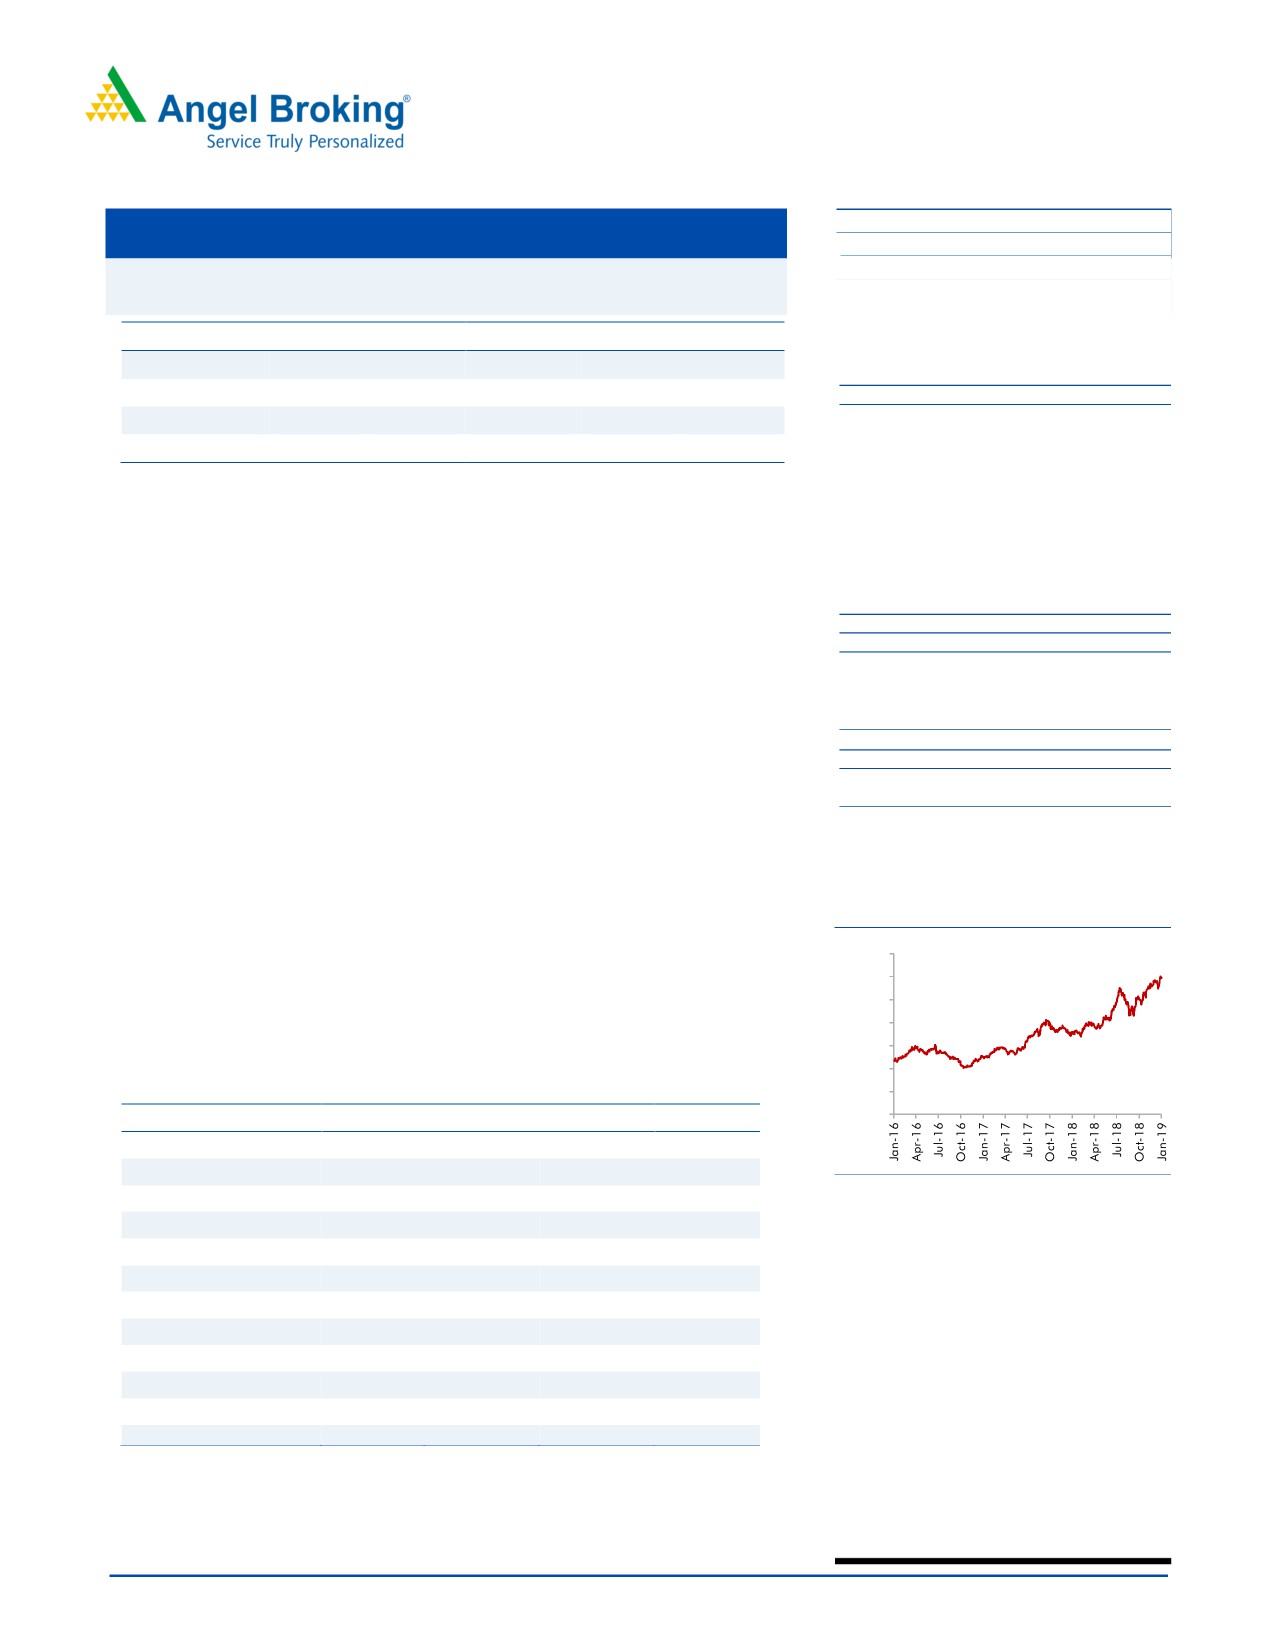
Historical share price chart
~`3,805cr over FY2019-21E mainly due to increasing brand consciousness
among Indian consumers, new product launches, higher number of store additions
1,400
in tier II/ III cities and focus on high growth women’s segment. Further, on the
1,200
bottom-line front, we expect CAGR of ~16% to `436cr over the same period on
1,000
the back of margin improvement (increasing premium product sales). Thus, we
800
600
maintain our Buy recommendation on Bata India with Target Price of `1,525.
400
Key Financials
200
0
Y/E March (` cr)
FY2018
FY2019
FY2020E
FY2021E
Net sales
2,634
2,931
3,309
3,805
% chg
6.5
11.3
12.9
15.0
Source: Company, Angel Research
Adj. Net profit
221
329
374
436
% chg
27.7
49.2
13.8
16.4
EBITDA margin (%)
13.3
16.3
27.2
26.0
EPS (`)
17.2
25.6
29.1
33.9
Research Analyst
P/E (x)
76.4
51.2
45.0
38.6
Amarjeet S Maurya
P/BV (x)
11.4
9.7
8.2
7.0
022-40003600 Ext: 6831
RoE (%)
15.0
18.9
18.3
18.0
RoCE (%)
19.7
23.7
29.5
28.4
EV/Sales (x)
6.2
5.5
4.8
4.0
EV/EBITDA (x)
46.2
33.5
17.5
15.5
Source: Company, Angel Research Note
Please refer to important disclosures at the end of this report
1
Bata India Ltd| 1QFY2020 Result Update
Exhibit 1: 1QFY2020 Performance
Y/E March (` cr)
1QFY20
1QFY19
% yoy
4QFY19
% qoq
FY2020
FY2019
% chg
Net Sales
882
797
10.6
679
29.8
2931
2634
11.3
Consumption of RM
399
372.7
7.2
291
37.1
1,287
1,202
7.0
(% of Sales)
45.3
46.7
42.9
43.9
45.6
Staff Costs
98
82
19.2
85
15.5
331
296
12.0
(% of Sales)
11.1
10.3
12.5
11.3
11.2
Selling & Adm Expenses
11
91
(88.2)
97
(88.9)
379
362
4.7
(% of Sales)
1.2
11.4
14.3
12.9
13.8
Other Expenses
131
120
9.5
112
17.2
457
423
8.0
(% of Sales)
14.8
15.0
16.4
15.6
16.0
Total Expenditure
639
665
(4.0)
585
9.3
2,454
2,283
7.5
Operating Profit
243
132
84.3
94
157.1
477
351
35.8
OPM
27.5
16.5
13.9
16.3
13.3
Interest
31
1
3,383.3
1
5,213.6
4
4
(15.5)
Depreciation
73
15
386.4
17
339.0
64
60
6.0
Other Income
17
12
41.3
28
(39.4)
68
50
35.5
PBT (excl. Ext Items)
156
128
21.6
105
47.8
478
337
41.7
Ext (Income)/Expense
-
-
-
-
-
PBT (incl. Ext Items)
156
128
21.6
105
47.8
478
337
41.7
(% of Sales)
17.6
16.0
15.5
16.3
12.8
Provision for Taxation
55
45
20.9
17
223.6
149
117
27.6
(% of PBT)
35.2
35.4
16.1
31.1
34.6
Reported PAT
101
83
22.0
88
14.1
328.99
221
49.2
PATM
11.4
10.4
13.0
11.2
8.4
Minority Interest After NP
Reported PAT
101
83
22.0
88
14.1
329
221
49.2
Extra-ordinary Items
Adj PAT
101
83
22.0
88
14.1
329
221
49.2
Equity shares (cr)
13
13
13
13
13
FDEPS (`)
7.8
6.4
22.0
6.9
14.1
25.6
17.2
49.2
Source: Company, Angel Research
August 3, 2019
2
Bata India Ltd| 1QFY2020 Result Update
Outlook and Valuation
We expect BIL to report net revenue CAGR of ~15% to ~`3,805cr over FY2019-
21E mainly due to increasing brand consciousness among Indian consumers, new
product launches, higher number of store additions in tier II/ III cities and focus on
high growth women’s segment. Further, on the bottom-line front, we expect CAGR
of ~16% to `436cr over the same period on the back of margin improvement
(increasing premium product sales). Thus, we maintain our Buy recommendation on
Bata India with Target Price of `1,525.
Downside risks to our estimates
Store expansion from competitors like Khadim and Relaxo could impact the
company’s sales growth.
Slowdown in economy could hurt the overall profitability of the company.
Company Background
BATA India Ltd (BIL) is the largest footwear retailer in India, offering footwear and
accessories & bags across brands like Bata, Hush Puppies, Naturalizer, Power,
Marie Claire, Weinbrenner, North Star, Scholl, Bata Comfit and Bubblegummers.
Currently, the company’s ~70% revenue is derived from Men & Kids footwear
segment and balance from women’s segment. BIL retails in over 1,290 Bata stores
on bata.in and has thousands of multi-brand footwear dealer stores pan-India.
August 3, 2019
3
Bata India Ltd| 1QFY2020 Result Update
Profit & Loss Statement
Y/E March (` cr)
FY2017
FY2018
FY2019
FY2020E
FY2021E
Net Sales
2,474
2,634
2,931
3,309
3,805
% chg
2.1
6.5
11.3
12.9
15.0
Total Expenditure
2,217
2,283
2,454
2,409
2,814
Raw Material
1,158
1,202
1,287
1,449
1,667
Personnel
273
296
331
381
441
Selling & Adm
356
362
379
427
491
Others Expenses
430
423
457
152
216
EBITDA
257
351
477
901
991
% chg
(6.8)
36.8
35.8
88.8
10.0
(% of Net Sales)
10.4
13.3
16.3
27.2
26.0
Depreciation& Amortisation
65
60
64
295
305
EBIT
192
291
413
606
686
% chg
(2.6)
51.6
42.0
46.6
13.2
(% of Net Sales)
7.8
11.0
14.1
18.3
18.0
Interest & other Charges
4
4
4
125
120
Other Income
46
50
68
70
75
(% of PBT)
19.7
14.9
14.3
12.7
11.7
Recurring PBT
234
337
478
551
641
% chg
(21.1)
44.1
41.7
15.3
16.4
Tax
75
117
149
176
205
(% of PBT)
32.0
34.6
31.1
32.0
32.0
PAT (reported)
159
221
329
374
436
Extraordinary Items
(14)
-
-
-
-
ADJ. PAT
173
221
329
374
436
% chg
3.9
27.7
49.2
13.8
16.4
(% of Net Sales)
7.0
8.4
11.2
11.3
11.4
Basic EPS (`)
13.4
17.2
25.6
29.1
33.9
Fully Diluted EPS (`)
13.4
17.2
25.6
29.1
33.9
% chg
3.9
27.7
49.2
13.8
16.4
August 3, 2019
4
Bata India Ltd| 1QFY2020 Result Update
Balance Sheet
Y/E March (` cr)
FY2017
FY2018
FY2019
FY2020E FY2021E
SOURCES OF FUNDS
Equity Share Capital
64
64
64
64
64
Reserves& Surplus
1,260
1,410
1,678
1,985
2,350
Shareholders Funds
1,324
1,475
1,742
2,049
2,414
Total Loans
-
-
-
-
-
Deferred Tax Liability
-
-
-
-
-
Total Liabilities
1,324
1,475
1,742
2,251
2,833
APPLICATION OF FUNDS
Gross Block
406
490
569
678
778
Less: Acc. Depreciation
138
193
253
331
419
Net Block
268
296
317
347
360
Capital Work-in-Progress
30
12
17
-
-
Investments
-
-
-
-
-
Current Assets
1,525
1,727
2,030
2,544
3,192
Inventories
714
765
839
979
1,136
Sundry Debtors
69
89
66
127
156
Cash
522
591
840
1,114
1,519
Loans & Advances
57
109
94
93
114
Other Assets
163
172
190
232
266
Current liabilities
599
667
732
741
818
Net Current Assets
926
1,061
1,298
1,803
2,373
Deferred Tax Asset
100
105
110
100
100
Mis. Exp. not written off
-
-
-
-
-
Total Assets
1,324
1,475
1,742
2,251
2,833
August 3, 2019
5
Bata India Ltd| 1QFY2020 Result Update
Consolidated Cashflow Statement
Y/E March (` cr)
FY2017
FY2018
FY2019
FY2020E FY2021E
Profit before tax
234
337
478
551
641
Depreciation
65
60
64
295
305
Change in Working Capital
53
(84)
5
(231)
(165)
Interest / Dividend (Net)
(40)
(45)
(63)
125
120
Direct taxes paid
(65)
(115)
(141)
(176)
(205)
Others
10
8
2
0
0
Cash Flow from Operations
257
160
345
563
695
(Inc.)/ Dec. in Fixed Assets
(48)
(75)
(82)
(100)
(100)
(Inc.)/ Dec. in Investments
(181)
(37)
(195)
0
0
Cash Flow from Investing
(229)
(112)
(278)
(100)
(100)
Issue of Equity
0
0
0
0
0
Inc./(Dec.) in loans
0
0
0
0
0
Dividend Paid (Incl. Tax)
(45)
(45)
(51)
(64)
(71)
Interest / Dividend (Net)
197
66
233
(125)
(120)
Cash Flow from Financing
152
21
182
(189)
(191)
Inc./(Dec.) in Cash
180
69
249
274
405
Opening Cash balances
342
522
591
840
1114
Closing Cash balances
522
591
840
1114
1519
August 3, 2019
6
Bata India Ltd| 1QFY2020 Result Update
Key Ratio
Y/E March
FY2017
FY2018
FY2019
FY2020E FY2021E
Valuation Ratio (x)
P/E (on FDEPS)
97.5
76.4
51.2
45.0
38.6
P/CEPS
75.2
59.9
42.8
25.2
22.7
P/BV
12.7
11.4
9.7
8.2
7.0
Dividend yield (%)
0.3
0.3
0.3
0.4
0.4
EV/Sales
6.6
6.2
5.5
4.8
4.0
EV/EBITDA
63.5
46.2
33.5
17.5
15.5
EV / Total Assets
12.3
11.0
9.2
7.0
5.4
Per Share Data ((`)
EPS (Basic)
13.4
17.2
25.6
29.1
33.9
EPS (fully diluted)
13.4
17.2
25.6
29.1
33.9
Cash EPS
17.4
21.9
30.6
52.1
57.6
DPS
3.5
4.0
4.5
5.0
5.5
Book Value
103.0
114.7
135.5
159.5
187.9
Returns (%)
ROCE
14.5
19.7
23.7
29.5
28.4
Angel ROIC (Pre-tax)
23.9
32.9
45.8
64.7
76.6
ROE
13.0
15.0
18.9
18.3
18.0
Turnover ratios (x)
Asset Turnover (Gross Block)
6.1
5.4
5.1
4.9
4.9
Inventory / Sales (days)
105
106
107
108
109
Receivables (days)
10
12
13
14
15
Payables (days)
62
57
56
56
55
Working capital cycle (ex-cash) (days)
54
61
64
66
69
August 3, 2019
7
Bata India Ltd| 1QFY2020 Result Update
Research Team Tel: 022 - 39357800
DISCLAIMER
Angel Broking Limited (hereinafter referred to as “Angel”) is a registered Member of National Stock Exchange of India Limited, Bombay
Stock Exchange Limited and Metropolitan Stock Exchange Limited. It is also registered as a Depository Participant with CDSL and Portfolio
Manager and Investment Adviser with SEBI. It also has registration with AMFI as a Mutual Fund Distributor. Angel Broking Limited is a
registered entity with SEBI for Research Analyst in terms of SEBI (Research Analyst) Regulations, 2014 vide registration number
INH000000164. Angel or its associates has not been debarred/ suspended by SEBI or any other regulatory authority for accessing
/dealing in securities Market. Angel or its associates/analyst has not received any compensation / managed or co-managed public
offering of securities of the company covered by Analyst during the past twelve months.
This document is solely for the personal information of the recipient, and must not be singularly used as the basis of any investment
decision. Nothing in this document should be construed as investment or financial advice. Each recipient of this document should make
such investigations as they deem necessary to arrive at an independent evaluation of an investment in the securities of the companies
referred to in this document (including the merits and risks involved), and should consult their own advisors to determine the merits and
risks of such an investment.
Reports based on technical and derivative analysis center on studying charts of a stock's price movement, outstanding positions and
trading volume, as opposed to focusing on a company's fundamentals and, as such, may not match with a report on a company's
fundamentals. Investors are advised to refer the Fundamental and Technical Research Reports available on our website to evaluate the
contrary view, if any
The information in this document has been printed on the basis of publicly available information, internal data and other reliable sources
believed to be true, but we do not represent that it is accurate or complete and it should not be relied on as such, as this document is for
general guidance only. Angel Broking Limited or any of its affiliates/ group companies shall not be in any way responsible for any loss
or damage that may arise to any person from any inadvertent error in the information contained in this report. Angel Broking Limited
has not independently verified all the information contained within this document. Accordingly, we cannot testify, nor make any
representation or warranty, express or implied, to the accuracy, contents or data contained within this document. While Angel Broking
Limited endeavors to update on a reasonable basis the information discussed in this material, there may be regulatory, compliance, or
other reasons that prevent us from doing so.
This document is being supplied to you solely for your information, and its contents, information or data may not be reproduced,
redistributed or passed on, directly or indirectly.
Neither Angel Broking Limited, nor its directors, employees or affiliates shall be liable for any loss or damage that may arise from or in
connection with the use of this information.
Disclosure of Interest Statement
Bata India
1. Financial interest of research analyst or Angel or his Associate or his relative
No
2. Ownership of 1% or more of the stock by research analyst or Angel or associates or relatives
No
3. Served as an officer, director or employee of the company covered under Research
No
4. Broking relationship with company covered under Research
No
Ratings (Returns):
Buy (> 15%)
Accumulate (5% to 15%)
Neutral (-5 to 5%)
Reduce (-5% to -15%)
Sell (< -15%)
August 3, 2019
8